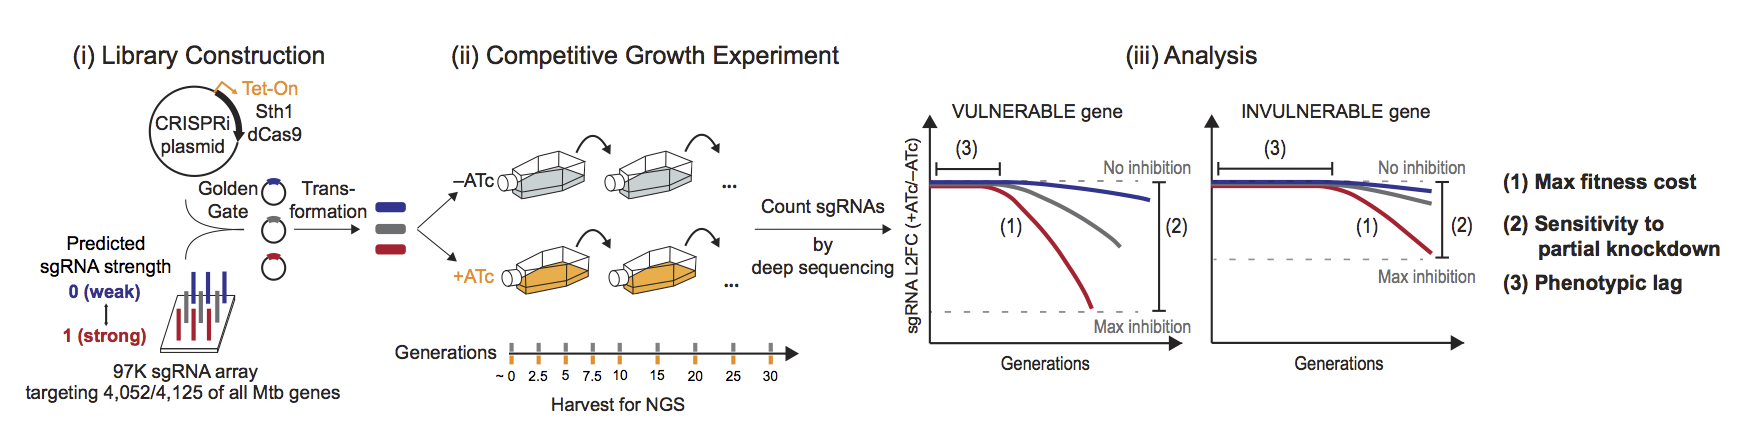
The Mtb and Msmeg CRISPRi libraries were constructed by cloning an sgRNA oligo array into an anhydrotetracycline (ATc)-inducible Sth1dCas9 vector. The libraries were designed to target all possible Mtb or Msmeg genes with sgRNAs of varying predicted knockdown efficiencies (Figure 1-i). Knockdown tuning was achieved by varying the PAM and sgRNA targeting sequence length. Triplicate cultures were passaged for approximately 30 generations in the presence (CRISPRi on) and absence of ATc (Figure 1-ii). At the indicated time points, genomic DNA was harvested and sgRNA targeting sequences amplified for next-generation sequencing. The relative fitness of individual strains was quantified by the sgRNA log2 fold change (L2FC) over time (+ATc/–ATc). Relative fitness values were then used to quantify three parameters that define target vulnerability: (1) maximum fitness cost (beta_max), (2) sensitivity to partial knockdown (M); and (3) the phenotypic lag between the timing of CRISPRi induction and the onset of a fitness defect (gamma) (Figure 1-iii).
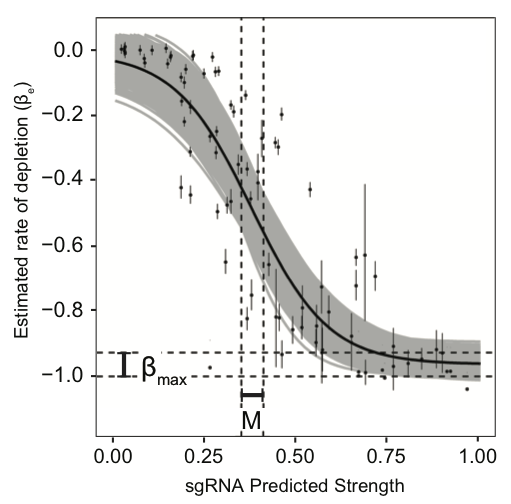
Example of the Hill curve used to model gene-level vulnerability (Figure 2). The x-axis depicts the predicted strengths of gene-targeting sgRNAs. The y-axis depicts the fitness cost of individual sgRNAs estimated by the sgRNA-level two-line model. Beta_max represent the maximum fitness costs estimated by the model. The predicted sgRNA strength at which fitness cost reaches the mid-point is defined by M, which represents a quantitative prediction of the sensitivity of a gene to partial depletion. The dark black line represents the mean logistic curve from 5,000 parameter samples. Grey shading represents the range of possible logistic curves obtained by the sampling procedure.
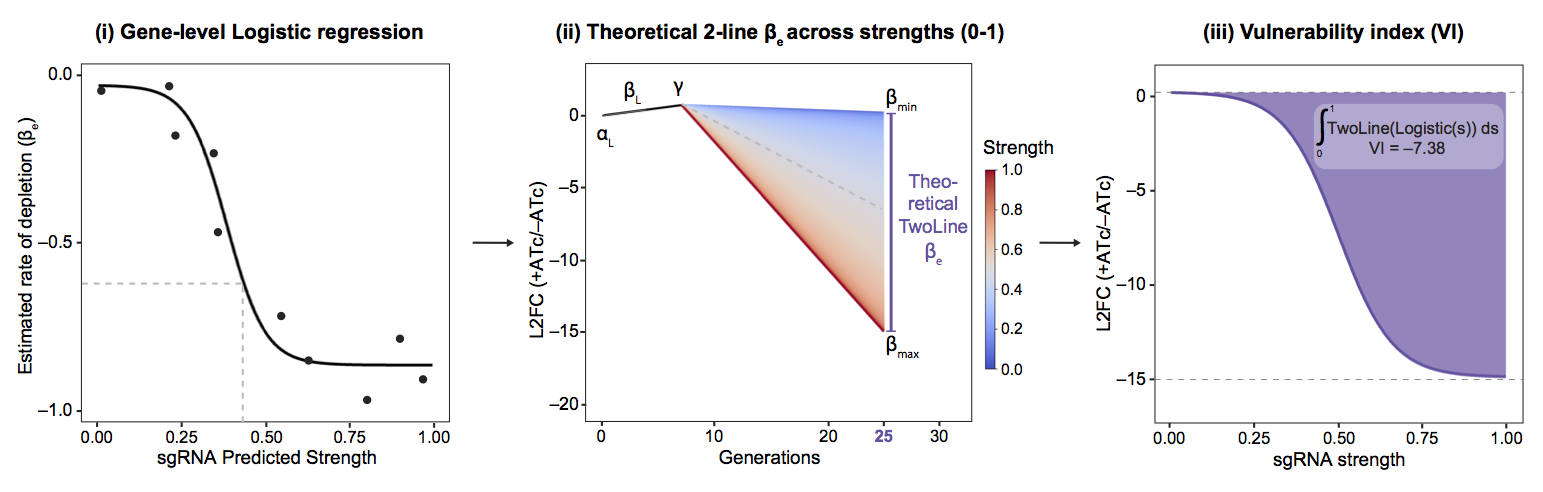
To summarize gene vulnerability into a single quantitative metric, we then integrated the predicted fitness costs for sgRNAs spanning the sgRNA strength range (0–1) for each gene. To do this, we first used the resulting fits from the Bayesian multilevel model (Figure 3-i) to predict the behavior of hypothetical sgRNAs targeting a given gene, using model fits when needed to impute the behavior of all possible sgRNA strengths not measured in our CRISPRi library (Figure 3-ii). The total fitness cost associated with all theoretical sgRNAs was combined into a single value using an integral (Figure 3-iii), which we refer to as the “vulnerability index” (VI) or gene vulnerability.